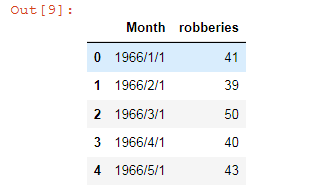
#時間資料型態
from datetime import datetime
now=datetime.now()
print(now)
print('年:',now.year, '月:',now.month,'日:' ,now.day)
print(datetime(2015,1,1))
delta=datetime(2015,1,1) - datetime(2014,8,10)
print(delta)
#String & Datetime 轉換
#String to Datetime
str='2016-07-07 14:30:22'
date=datetime.strptime(str,'%Y-%m-%d %H:%M:%S')
print(date)
# Datetime to String
date=datetime(2015,1,1)
str_date= datetime.strftime(date,'%Y-%m-%d %H:%M:%S')
print(str_date)
output:
#Pandas DatetimeIndex 將index轉為時間,做時間序列分析會比較方便
boston=boston.set_index(boston['Month'],drop=True)
del boston['Month']
boston.head()
boston.index=pd.to_datetime(boston.index,format='%Y-%m-%d') #把index轉換成datetime
boston.head()

#時間序列分析(Time Series Analysis) 視覺化
boston.plot(x=boston.index,kind='line')
plt.show()

#DatetimeIndex 時間分割/聚合
boston_year=boston.groupby(boston.index.year).mean() #根據年做group by
print(boston_year.head())
boston_year.plot(kind='line')
plt.show()

boston_Q =boston.resample('Q-NOV').mean() #以季切分 12月為開始當做第一季 做一季一季切分
print(boston_Q.head())
boston_Q[boston_Q.index.year>1973]
boston_Q.plot(kind='line')
plt.show()


 留言列表
留言列表


