一時興起 想探討巴哈XX版 GP值與回覆數之間有甚麼關聯~
************網路爬蟲***********************
1.
爬巴哈1~20頁標題
smarttitle=NULL
for(i in 1:20){
pathfile=paste("https://forum.gamer.com.tw/B.php?page=",i,"&bsn=04212",sep="") #產生讀取網頁檔案的路徑
mtitle=read_html(pathfile) %>%
html_nodes(".FM-blist3") %>% #用Selector選擇抓標題後得到的程式碼
html_text() %>% iconv("UTF-8") #抓文字
smarttitle=c(smarttitle,mtitle) #將每次for迴圈產的一頁的標題儲存到smarttitile
}
smarttitle =data.frame(smarttitle)
2.
爬巴哈1~20頁GP值
GP=NULL
for(i in 1:20){
pathfile=paste("https://forum.gamer.com.tw/B.php?page=",i,"&bsn=04212",sep="") #產生讀取網頁檔案的路徑
mtitle=read_html(pathfile) %>%
html_nodes(".FM-blist4") %>% #用Selector選擇抓標題後得到的程式碼
html_text() %>% iconv("UTF-8") #抓文字
GP=c(GP,mtitle) #將每次for迴圈產的一頁的標題儲存到GP
}
GP =data.frame(GP)
3.爬巴哈1~20頁回覆數
shin=NULL
for(i in 1:20){
pathfile=paste("https://forum.gamer.com.tw/B.php?page=",i,"&bsn=04212",sep="") #產生讀取網頁檔案的路徑
mtitle=read_html(pathfile) %>%
html_nodes(".FM-blist5") %>% #用Selector選擇抓標題後得到的程式碼
html_text() %>% iconv("UTF-8") #抓文字
shin=c(shin,mtitle) #將每次for迴圈產的一頁的標題儲存到shin
}
shin =data.frame(shin)
參考:http://brucehau.blogspot.tw/2016/09/rrvest.html
************以下是資料ETL********************
1.
合併標題與GP值
baha <-cbind(smarttitle,GP,shin)
2.
刪除遺漏值
baha <- baha[complete.cases(baha),]
3.
GP值去除前面的+
baha$GP <-substr(baha$GP,2,5)
GP值轉成數值
baha$GP <- as.integer(baha$GP)
GP的NA轉成0
baha_1 <- baha$GP
baha_1[is.na(baha_1)] <-0
baha$GP <- baha_1
4.
回覆數丟進資料庫只抓取回覆數
省略...
大致語法:Select substr(shin,1,instr( shin, '/' )-1) as shin from baha_shin;
5.回覆數轉換成數值
baha$shin <- as.integer(baha$shin)
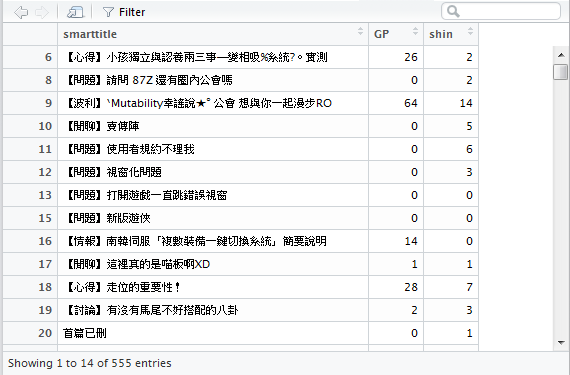
處理完的dataset:

***********資料視覺化*********************
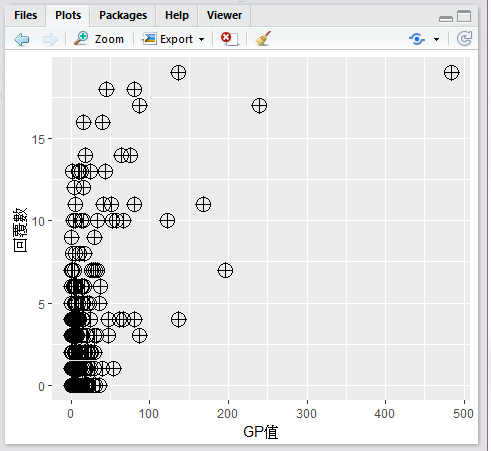
查看 GP值與回覆數的散布圖
好像看的到一點趨勢...但不明顯 ><
ggplot(baha,aes(x=GP,y=shin)) + geom_point(shape=10,size=5) +labs(x="GP值" ,y="回覆數")

看一下兩個指標的相關性好了
cor(baha$GP,baha$shin)
[1] 0.5412876
雖然是正相關但相關性沒有很高... 哈哈
來做個回歸預測? 預測一下GP值好了 用回覆數當變數
**************回歸分析**********************
訓練模型:
#lm(y~x)
> bahaLM <- lm(GP~shin ,baha)
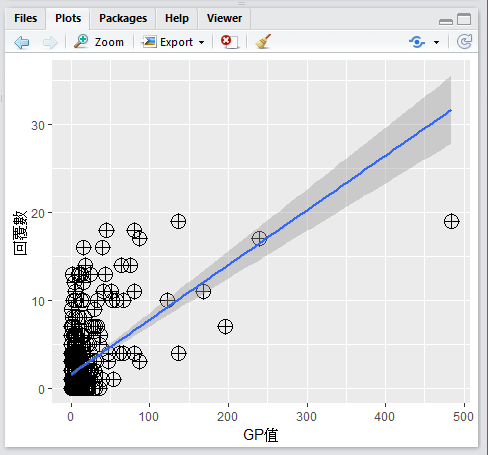
#散佈圖 加上模型預測區域
ggplot(baha, aes(x = GP, y = shin)) + geom_point(shape = 10, size = 5) +
+ geom_smooth(method = lm) + labs(x = "GP值", y = "回覆數")

#從模型摘要summary()中取得方程式參數
> summary(bahaLM)
Call:
lm(formula = GP ~ shin, data = baha)
Residuals:
Min 1Q Median 3Q Max
-57.96 -6.91 1.36 1.36 395.92
Coefficients:
Estimate Std. Error t value Pr(>|t|)
(Intercept) -1.364 1.246 -1.095 0.274
shin 4.708 0.311 15.138 <2e-16 ***
---
Signif. codes: 0 ‘***’ 0.001 ‘**’ 0.01 ‘*’ 0.05 ‘.’ 0.1 ‘ ’ 1
Residual standard error: 24.92 on 553 degrees of freedom
Multiple R-squared: 0.293, Adjusted R-squared: 0.2917
F-statistic: 229.2 on 1 and 553 DF, p-value: < 2.2e-16
#R-squared是簡單評估迴歸模型預測準度的數值,圖中為0.293,越接近1,解釋力越強大。
回歸解釋力好低............... 哈哈^^"
#可以從模型摘要中取得方程式中的參數
常數a=-1.364
係數b=4.708
#利用預測函數取得結果
> new <- data.frame(shin = 17)
> result <- predict(bahaLM, newdata = new)
> result
1
78.6686 <<預測出來的結果是78.6686
另外,做了巴哈前XX版前20頁的文字雲
可發現,標題最常出現的字是 [問題] > [情報] > [心得]
可參考我的置頂文章文字雲的製作 : http://to52016.pixnet.net/blog/post/342915697

###隨便玩一通 看看就好


 留言列表
留言列表


